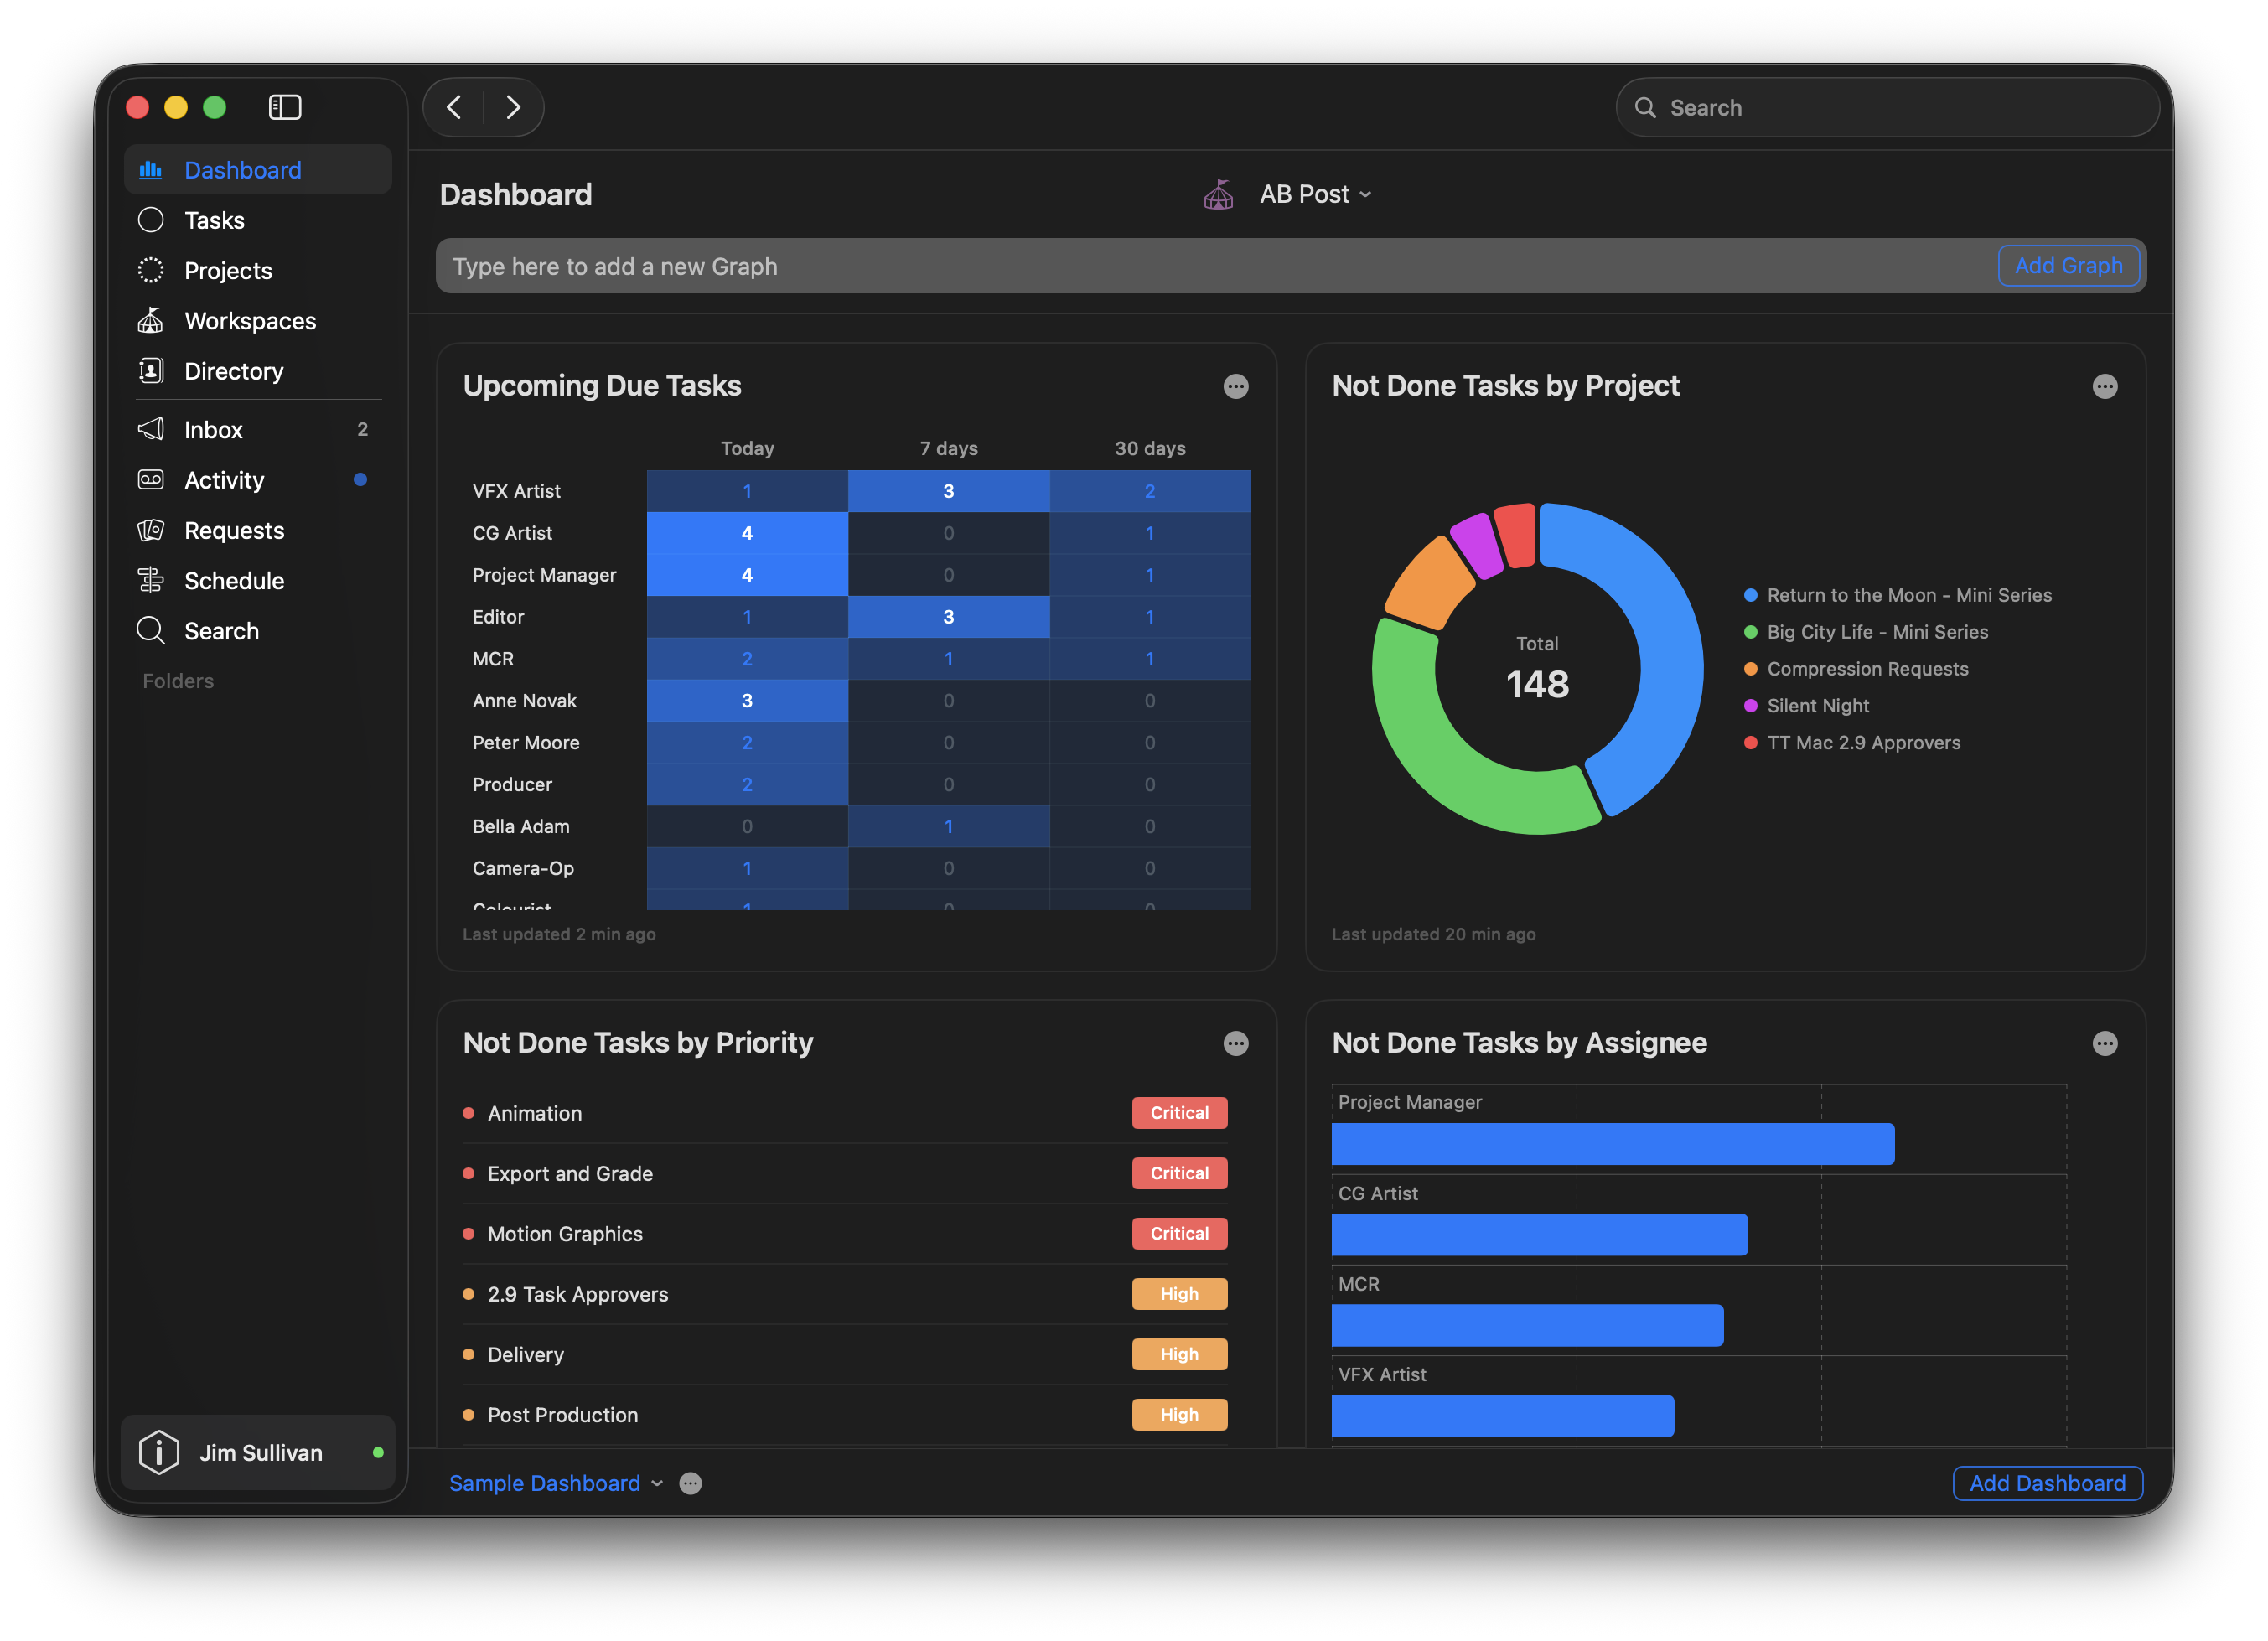
Dashboards give you a quick visual overview of the work happening across your Cirkus Workspace.
You can create Dashboards with graphs showing Tasks, Projects, Project Milestones and Quotes information such as status, assignees, value, projects and due dates, making it easier to see what is in progress, what has been completed and where your team needs to focus.
Dashboards can be Personal, or shared with your Workspace, so everyone with Dashboard access is looking at the same summary information.
Dashboards are available on Web, Mac and iOS platforms
 Before you Begin
Dashboards are a Workspace level feature.
This is important because the information shown in a Dashboard is a summary of Tasks, Projects and Quotes from across the Workspace, and is not limited to only the Projects that the person viewing the Dashboard has joined.
For example, if you are a Workspace Member with permission to view Dashboards, a graph showing Tasks by Project can include summary information from Projects where you are not personally a Project Member.
Dashboard access is controlled by Workspace permissions.
By default:
- Workspace Administrators can view and edit Dashboards.
- Workspace Members can view Dashboards.
- Limited Members cannot view or edit Dashboards.
If you do not see the Dashboard option in Cirkus, check your Workspace access and permissions.
Open Dashboards
Select Dashboards from the Cirkus left menu.
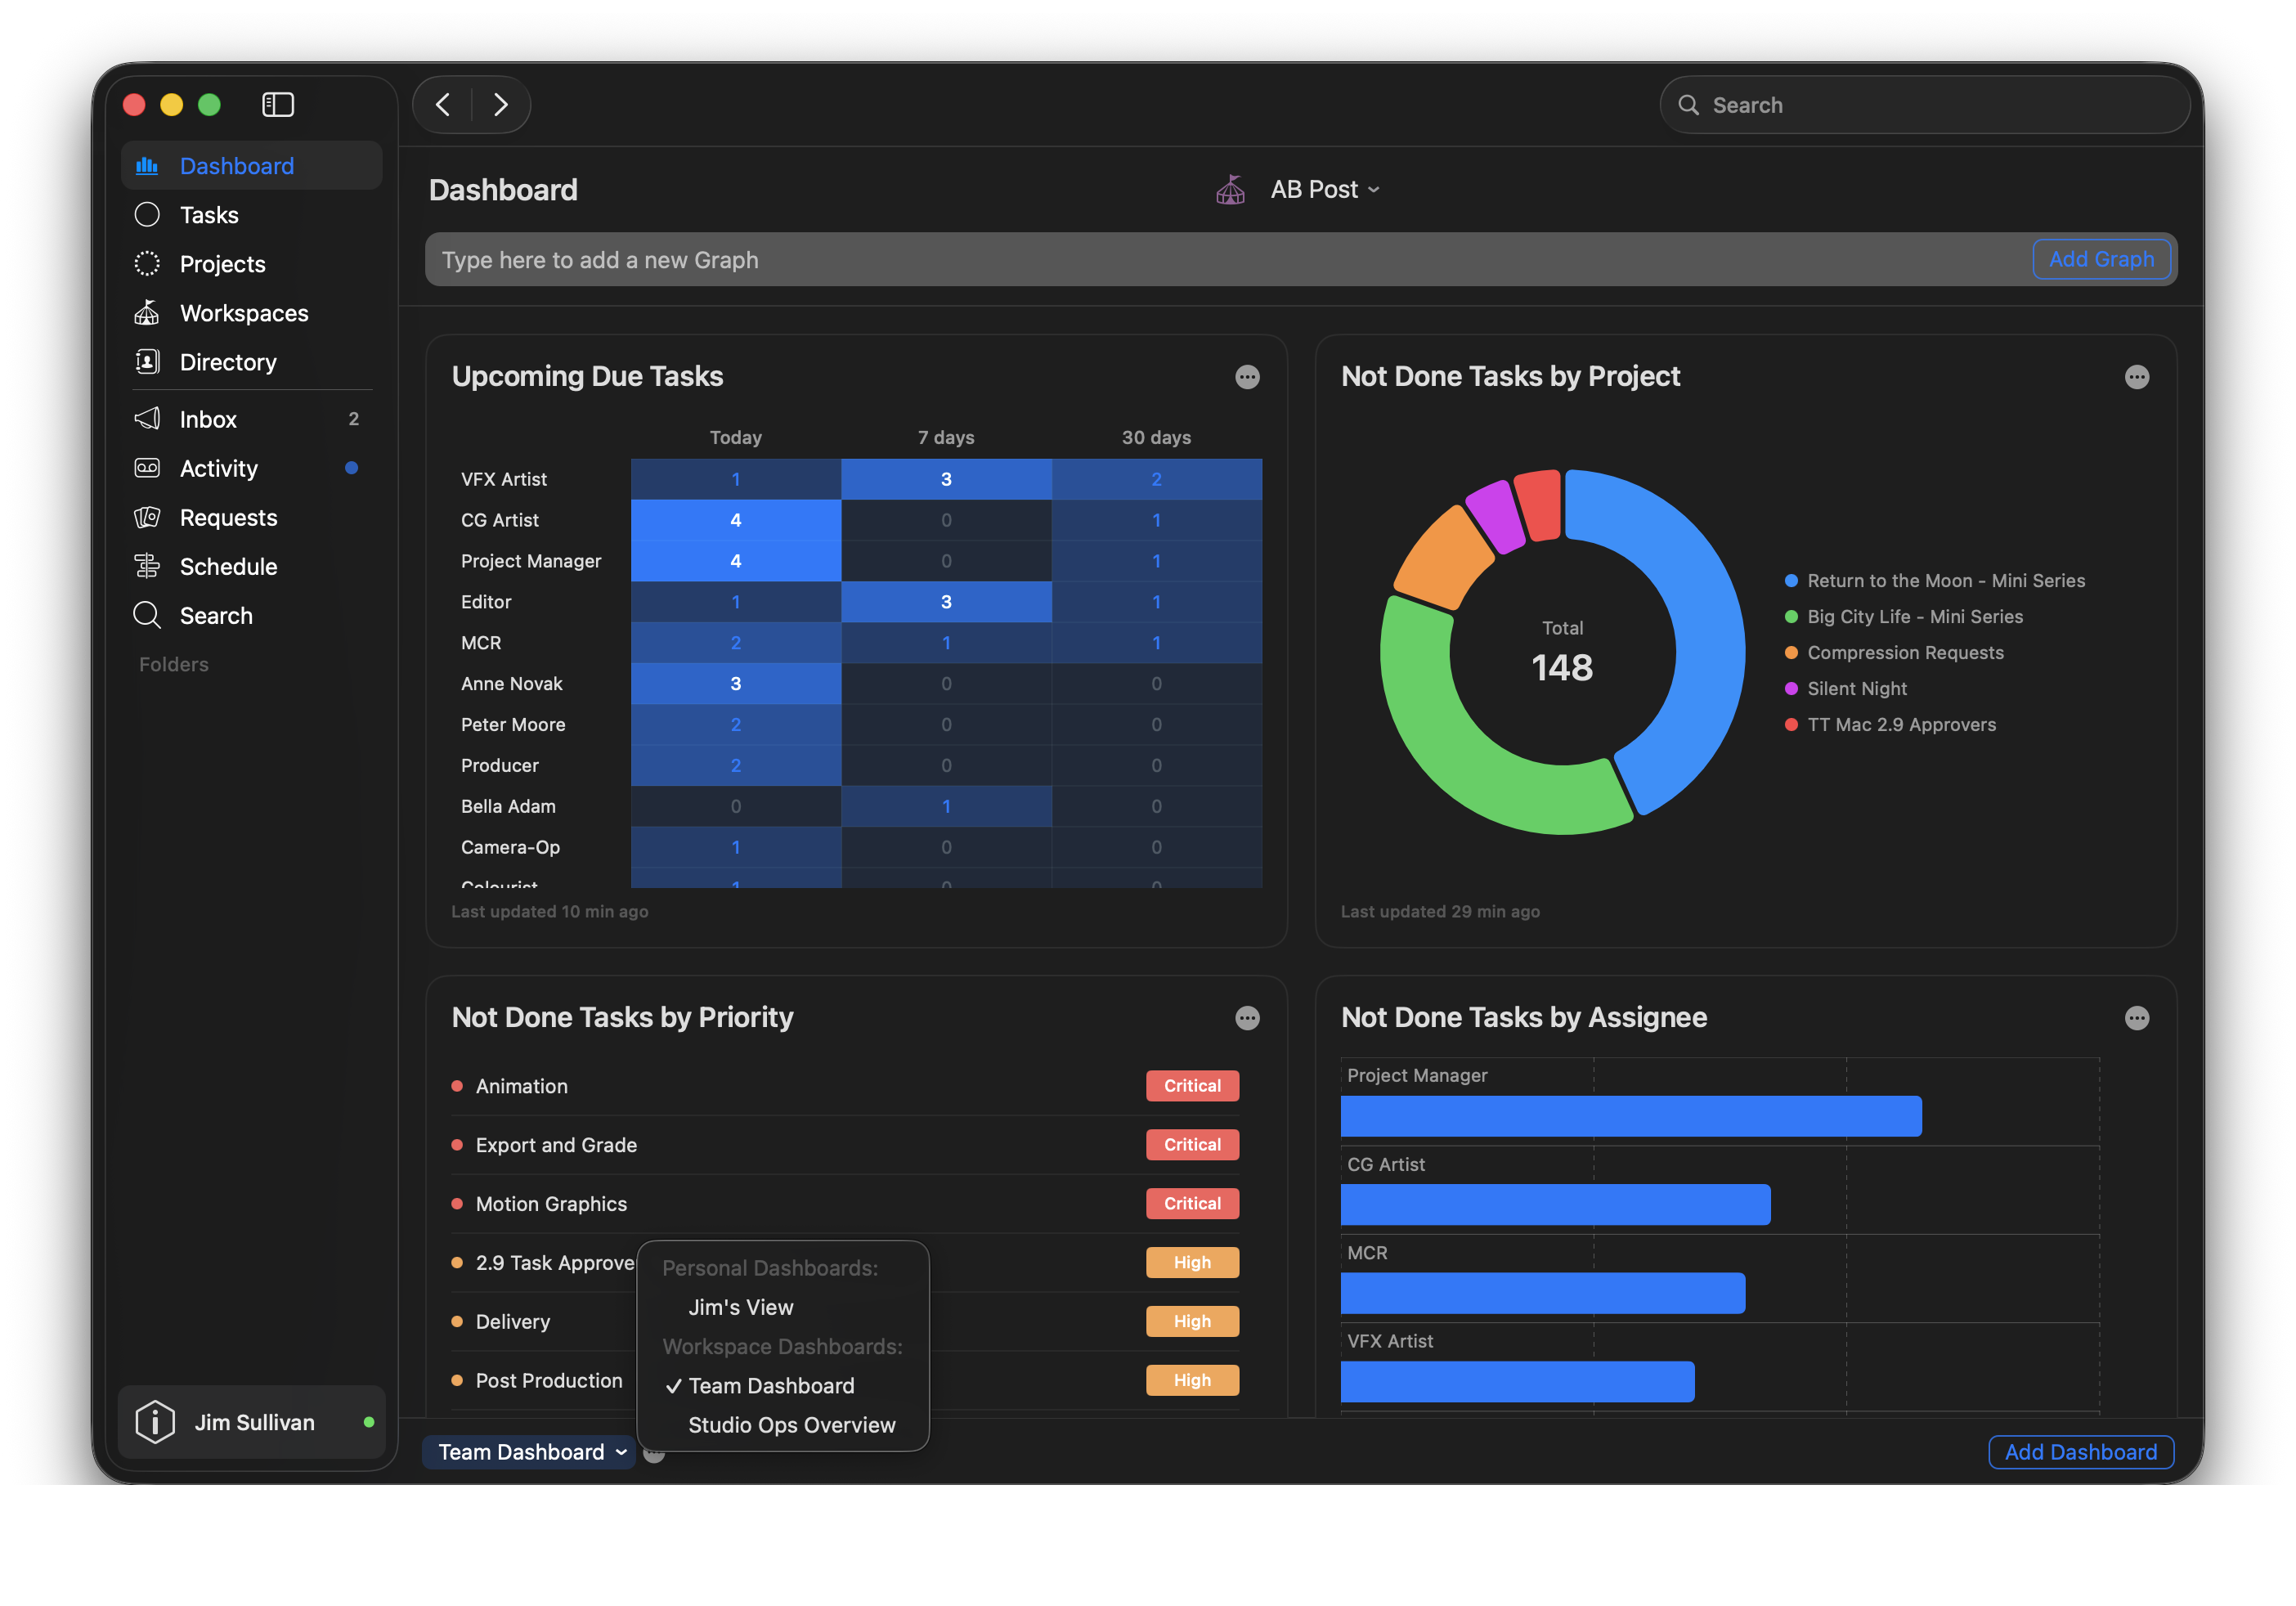
If you are a member of more than one Workspace with Dashboard access, you can select the Workspace you would like to report on at the top/bottom of the View depending on your platform
The Dashboard view will show the Dashboards available for the selected Workspace.
Create a Sample Dashboard
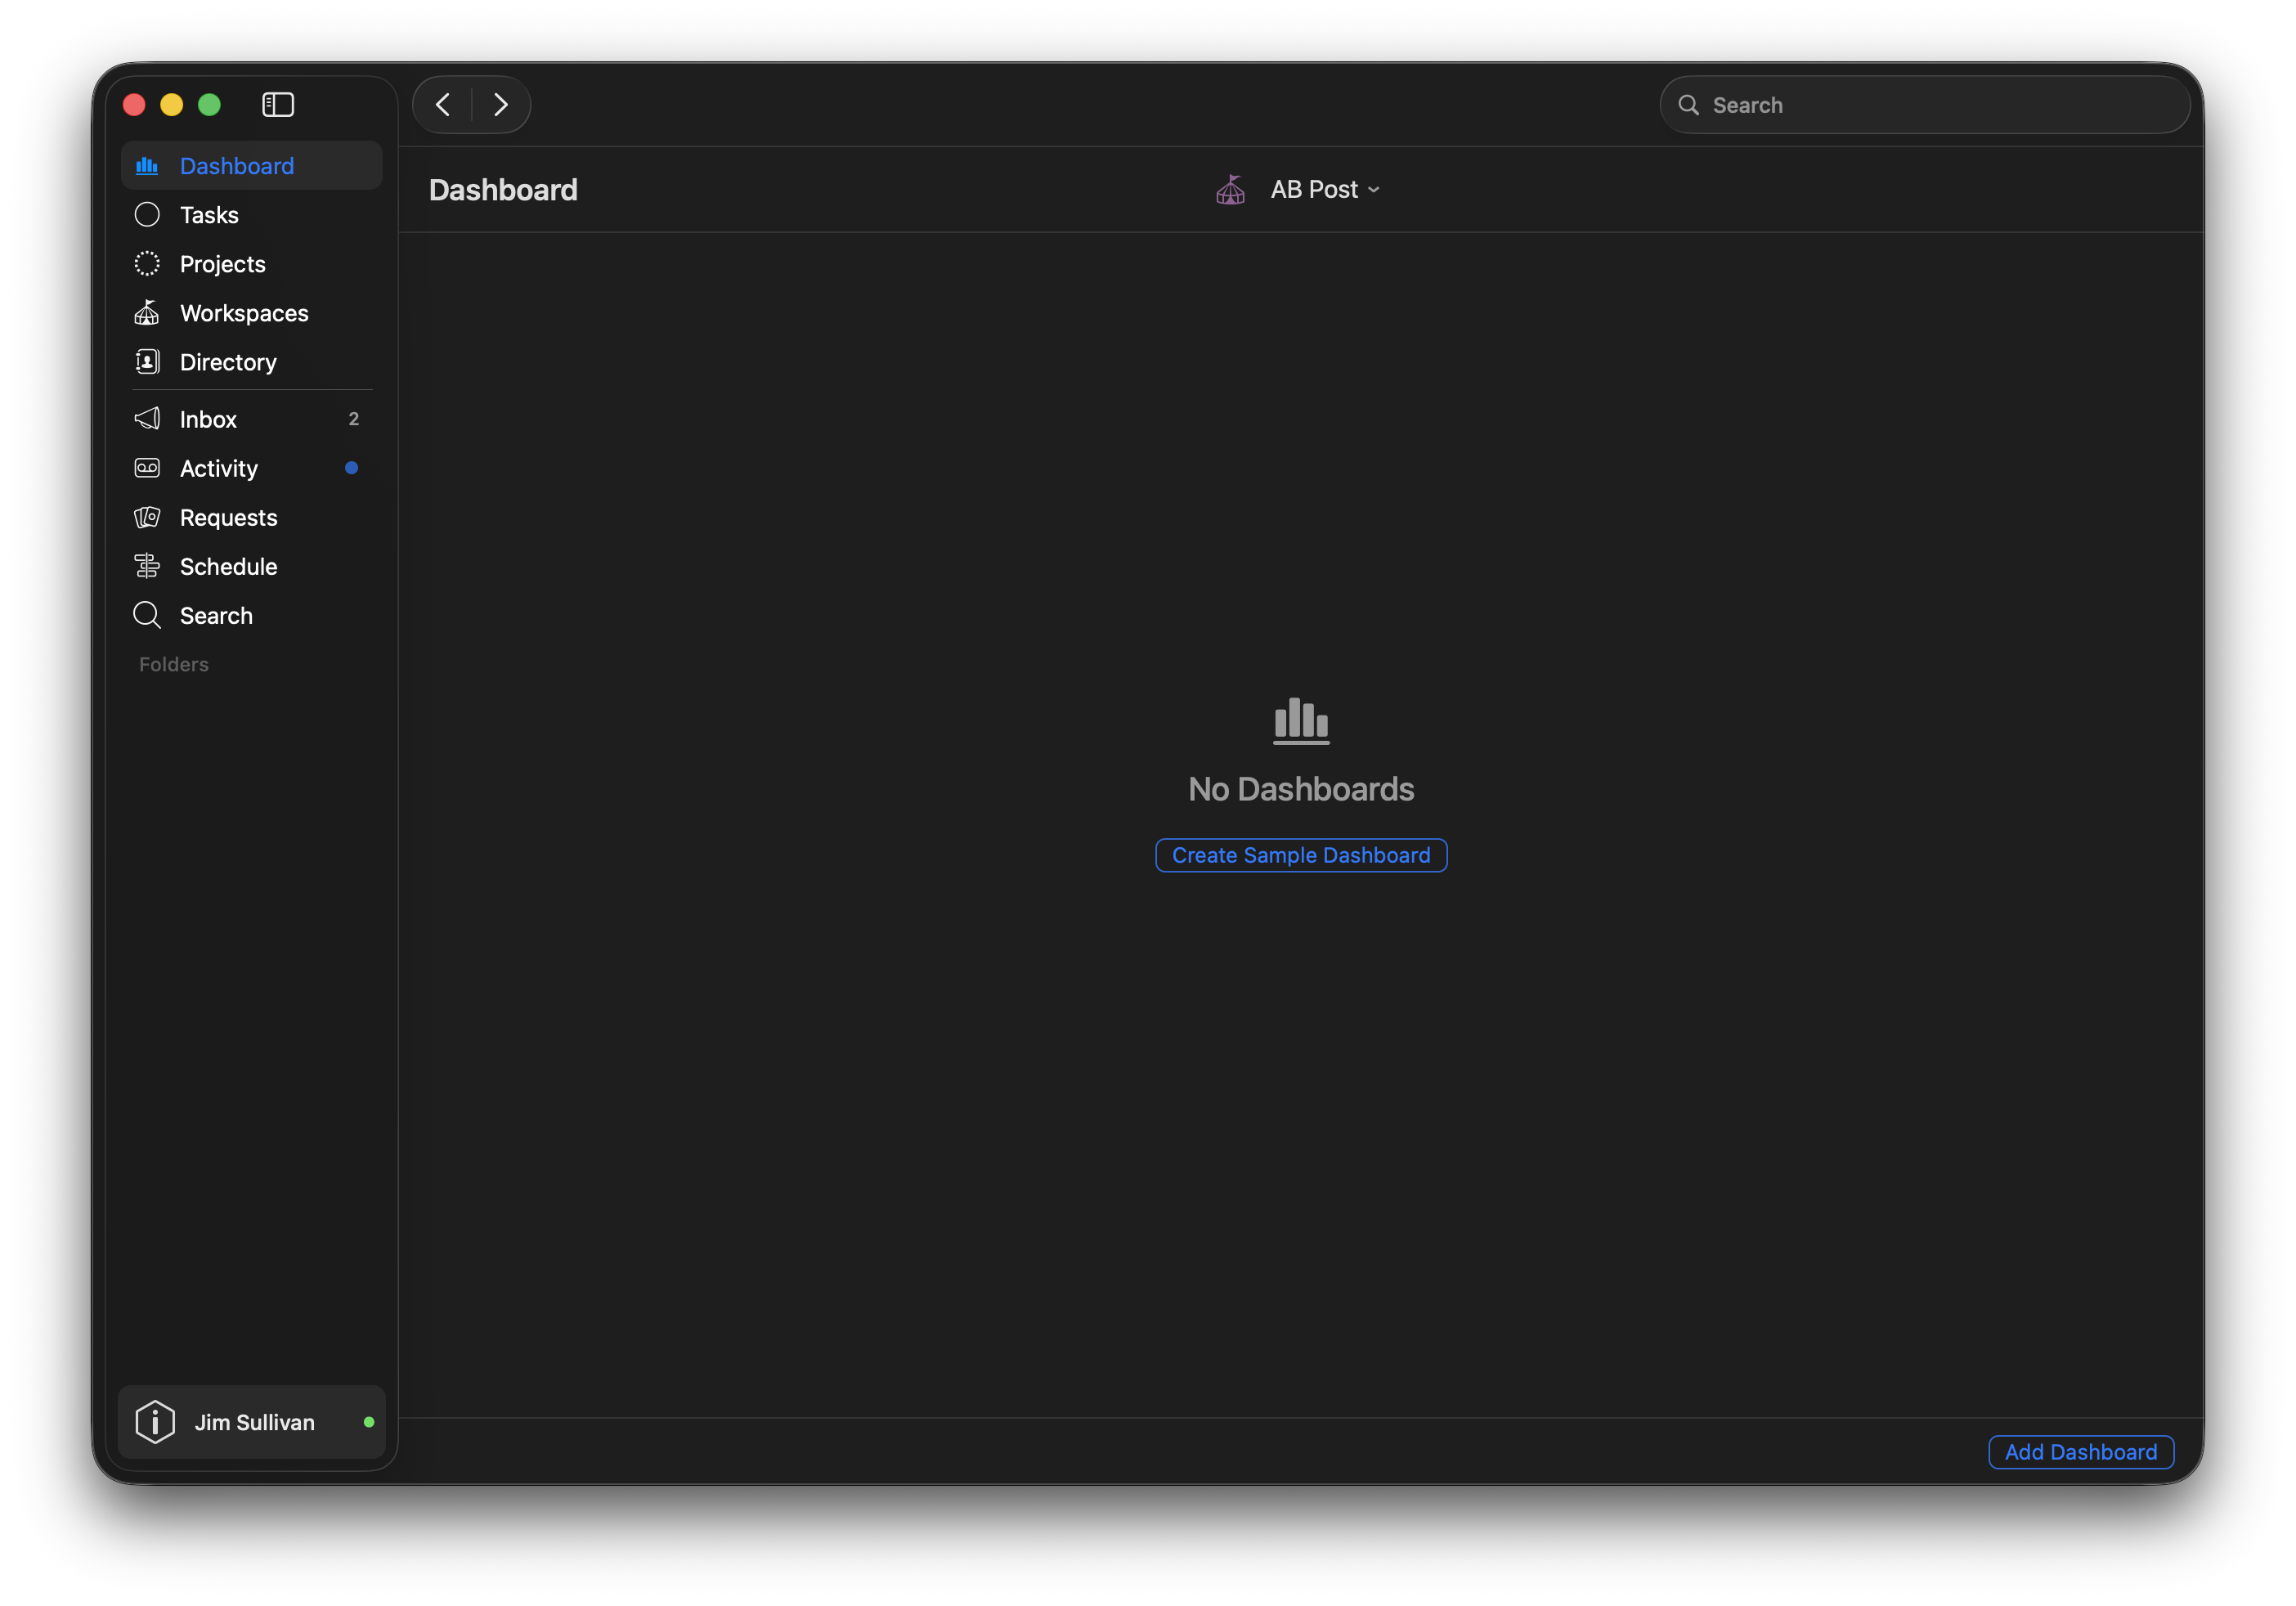
If you are a Workspace Administrator and there are no Dashboards set up yet, Cirkus can create a Sample Dashboard for you.
This is the quickest way to get started and see some examples of the information you can display.
From the empty Dashboard view, click Create Sample Dashboard.
Cirkus will create a shared Dashboard containing four example Graphs.
Once it has been created, the new Dashboard will open automatically.
The example Graphs are limited to the Top 5 results, and you can then edit the Dashboard and its Graphs to match the information your team wants to track.
Create a new Dashboard
If you have permission to edit Dashboards, you can create additional Dashboards using the [Add Dashboard] option in the bottom left.
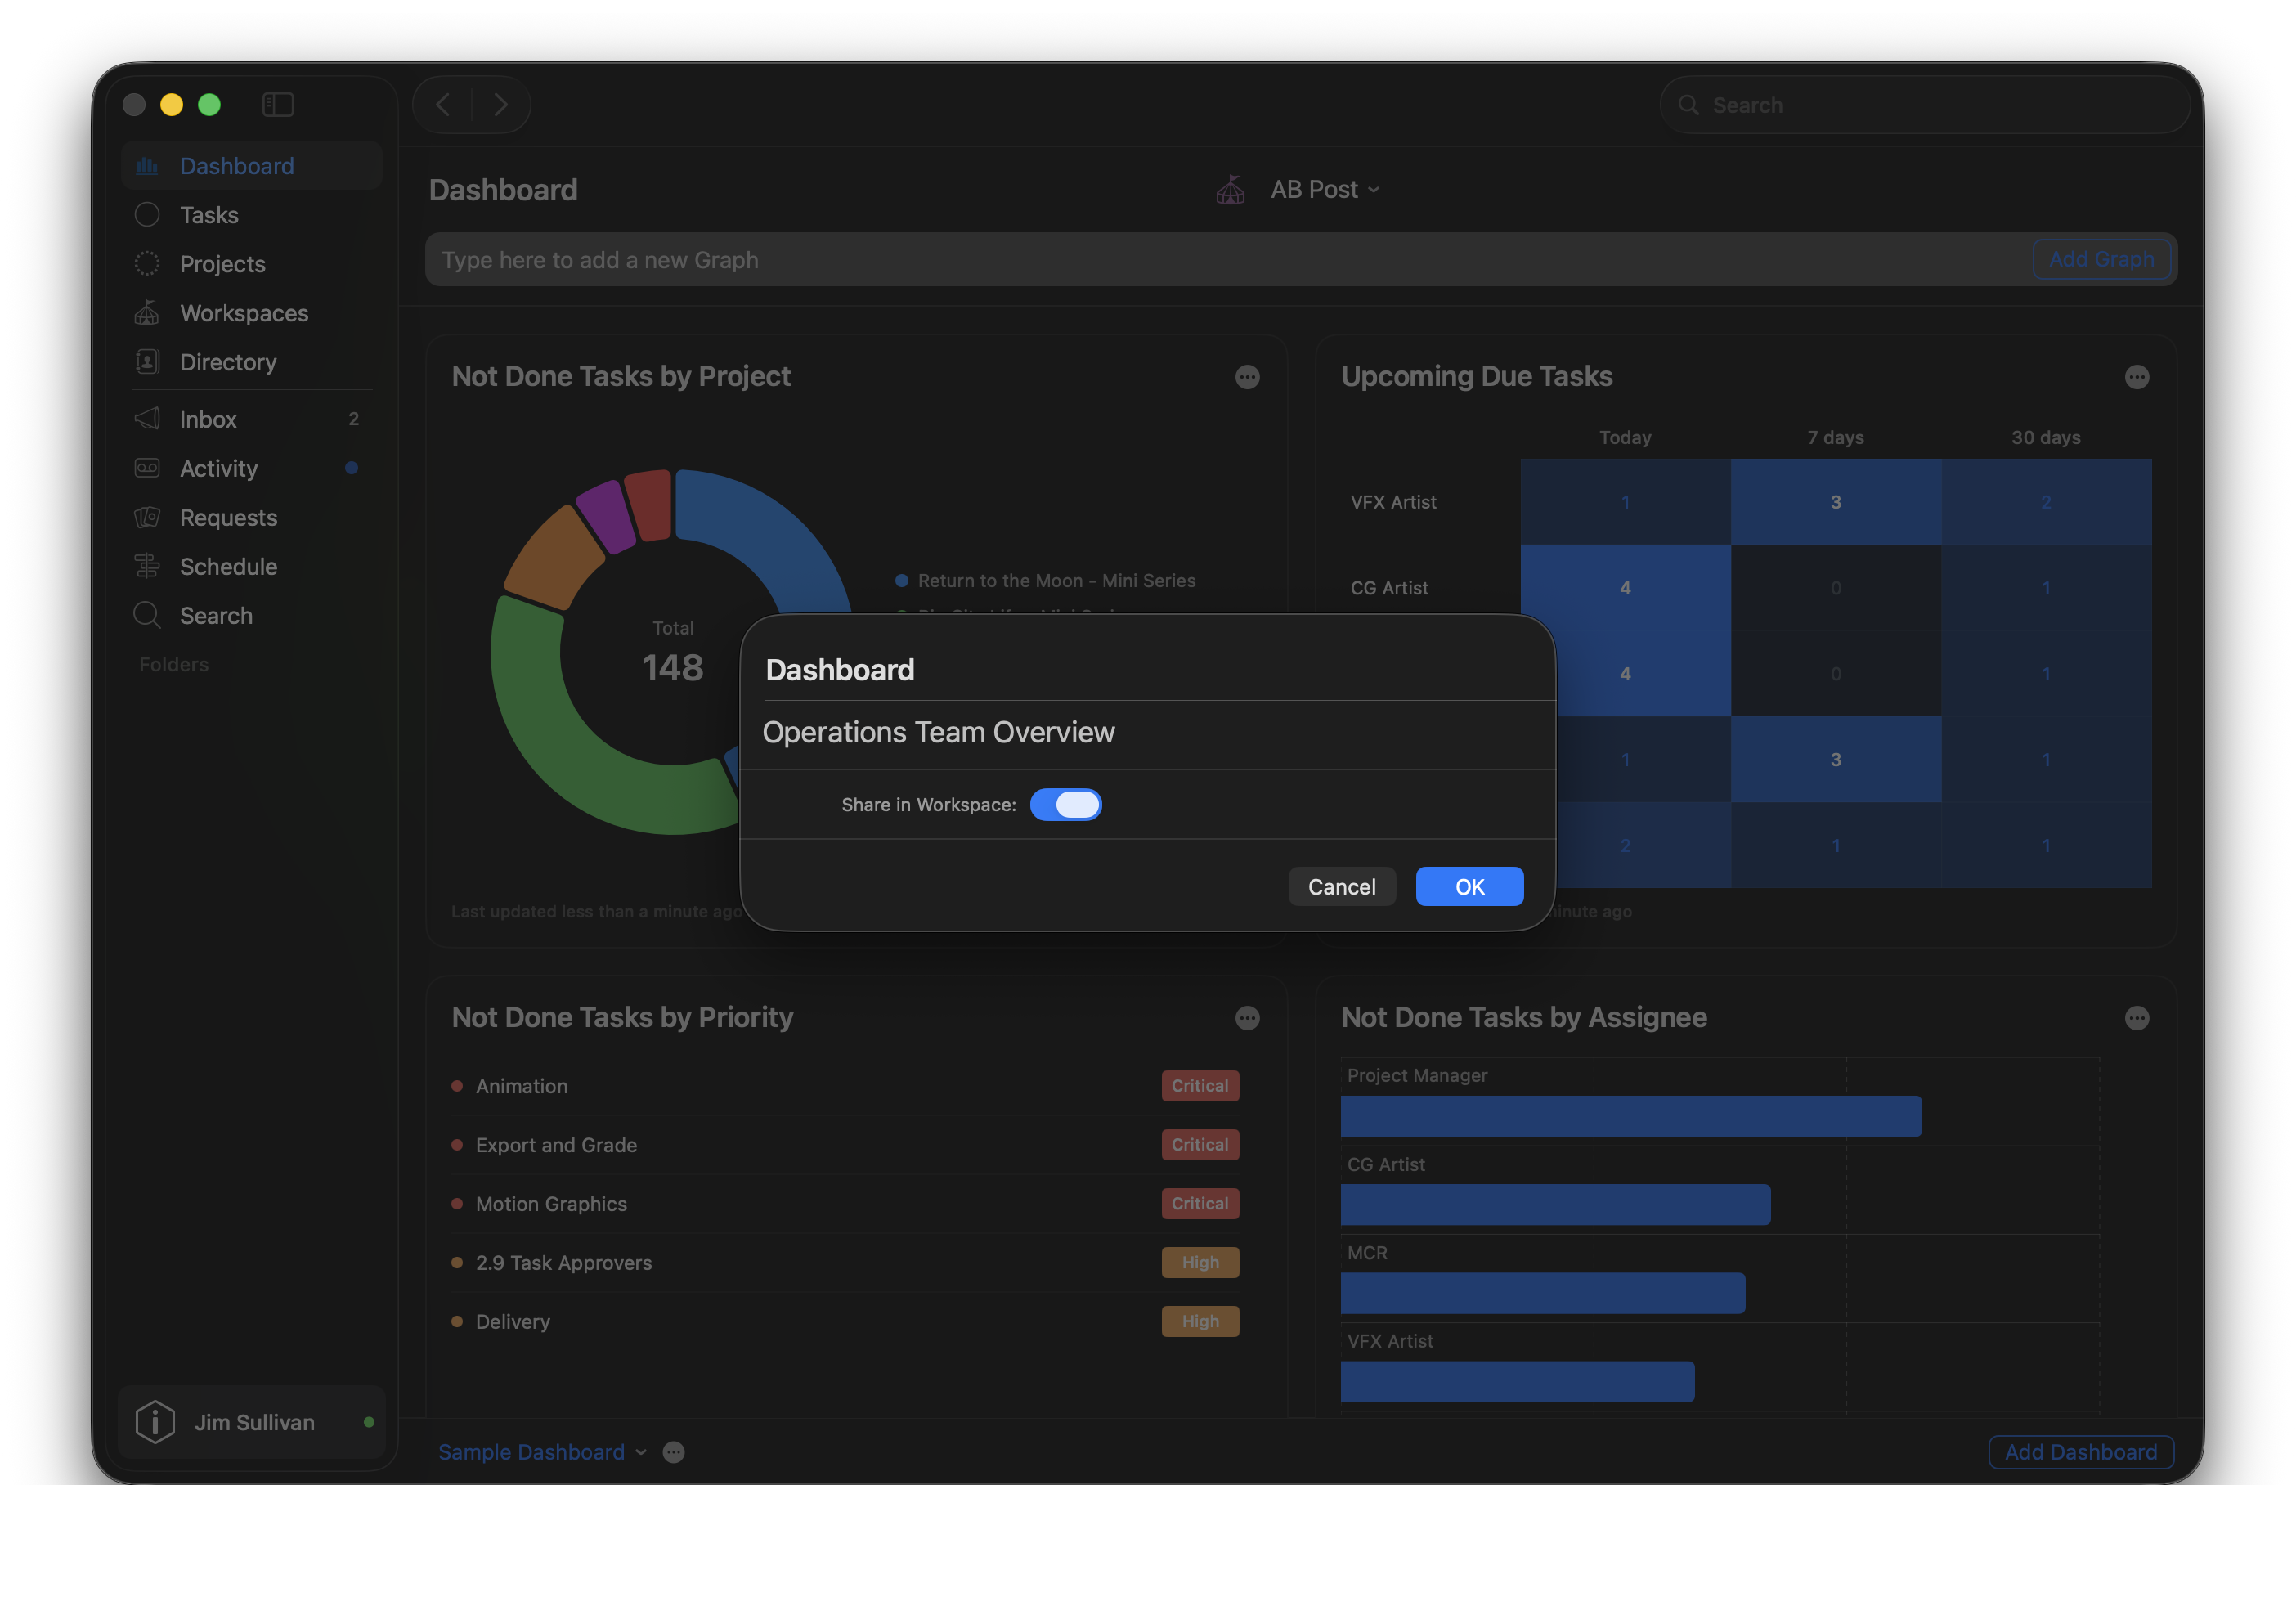
Enter a name for your Dashboard and save it.
Share in Workspace is enabled by default when creating a new Dashboard. This means it will appear in the bottom selector for all Workspace Admins and Members.
If the Dashboard is for your own use, untick Share in Workspace and it will be only visible to you
Once the Dashboard has been created, you can start adding Graphs.
Add and configure Graphs
Graphs are the individual reports displayed inside a Dashboard.
Open the Dashboard where you want to add the Graph and select the [Add Graph] from the top bar, option to add a new Graph.
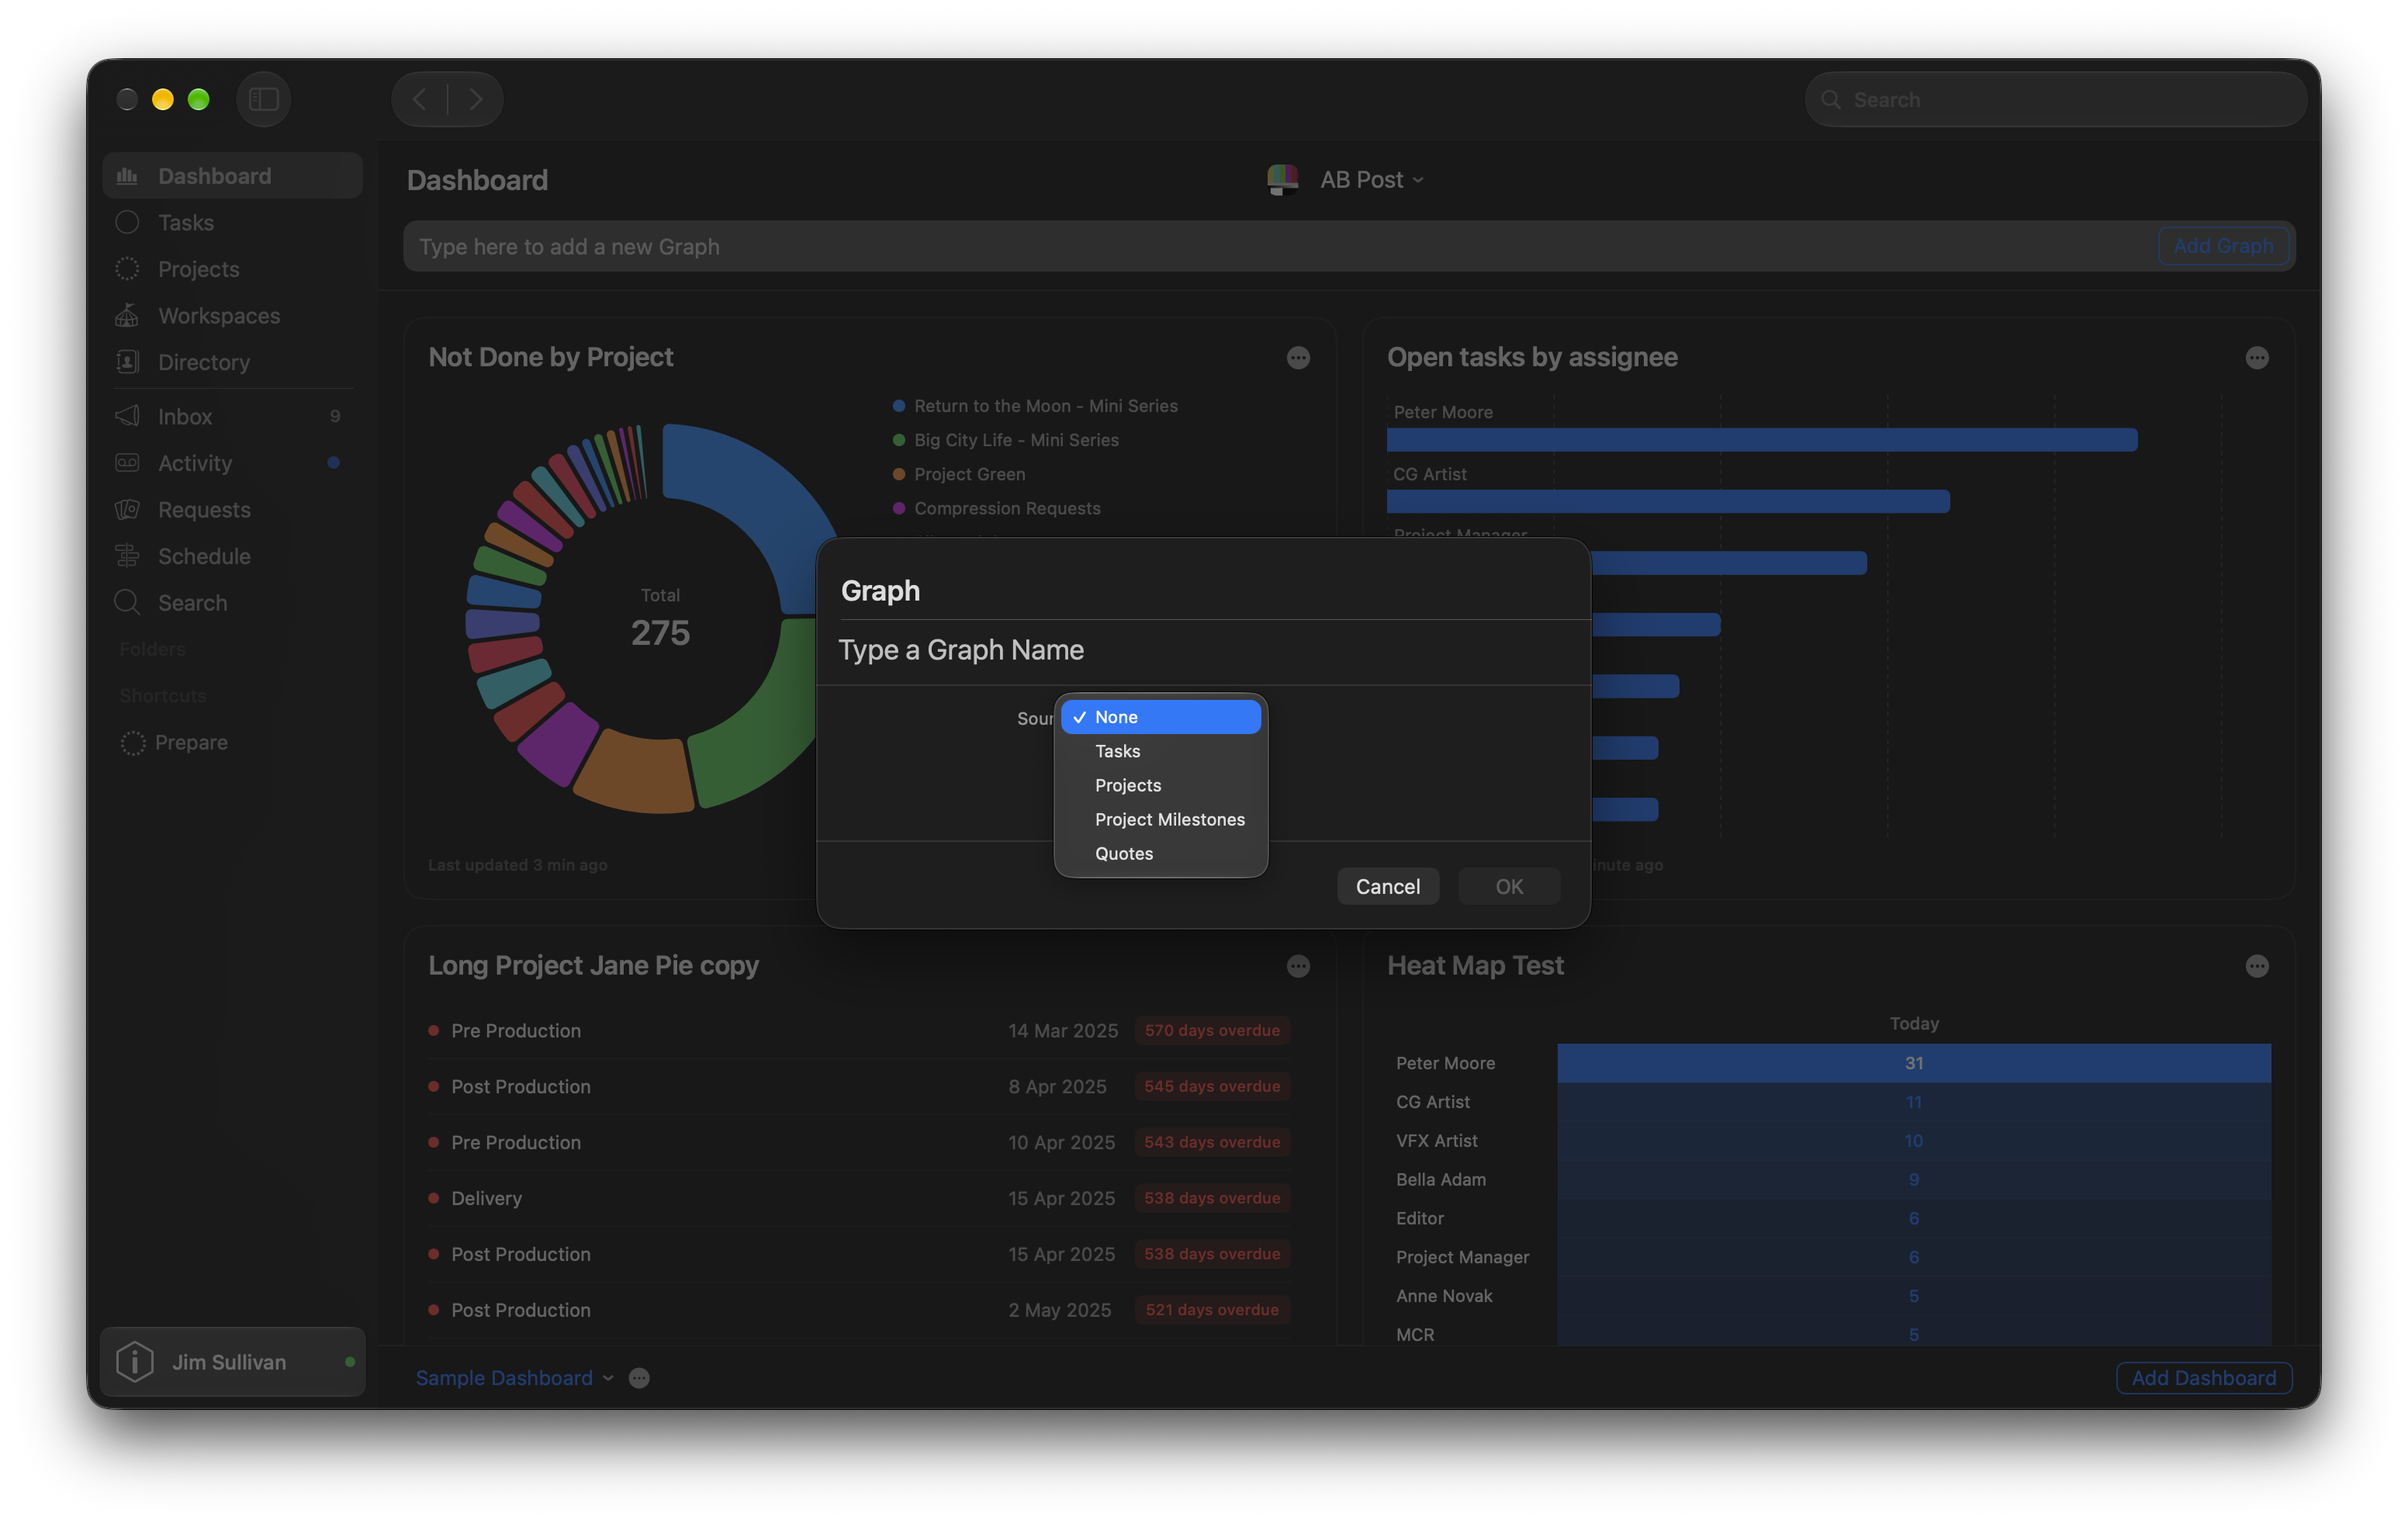
Give your Graph a useful name which describes the information it shows, for example:
- Tasks Not Done by Assignee
- Tasks In Progress by Assignee
- Tasks Done / Not Done by Project
- Tasks Due Soon
You can then configure the information you want to include.
The available options depend on the type of Graph and the filters selected.
For Task Graphs you can use criteria such as:
- Task Status
- Project
- Assignee
- Task Template
- Due Date
For Projects/Milestones you can filter by Company, Project Template or Specific Projects, and for Quotes by Project criteria, Currency and status.
Where a selector allows multiple values, you can select individual items or use Select All / Deselect All.
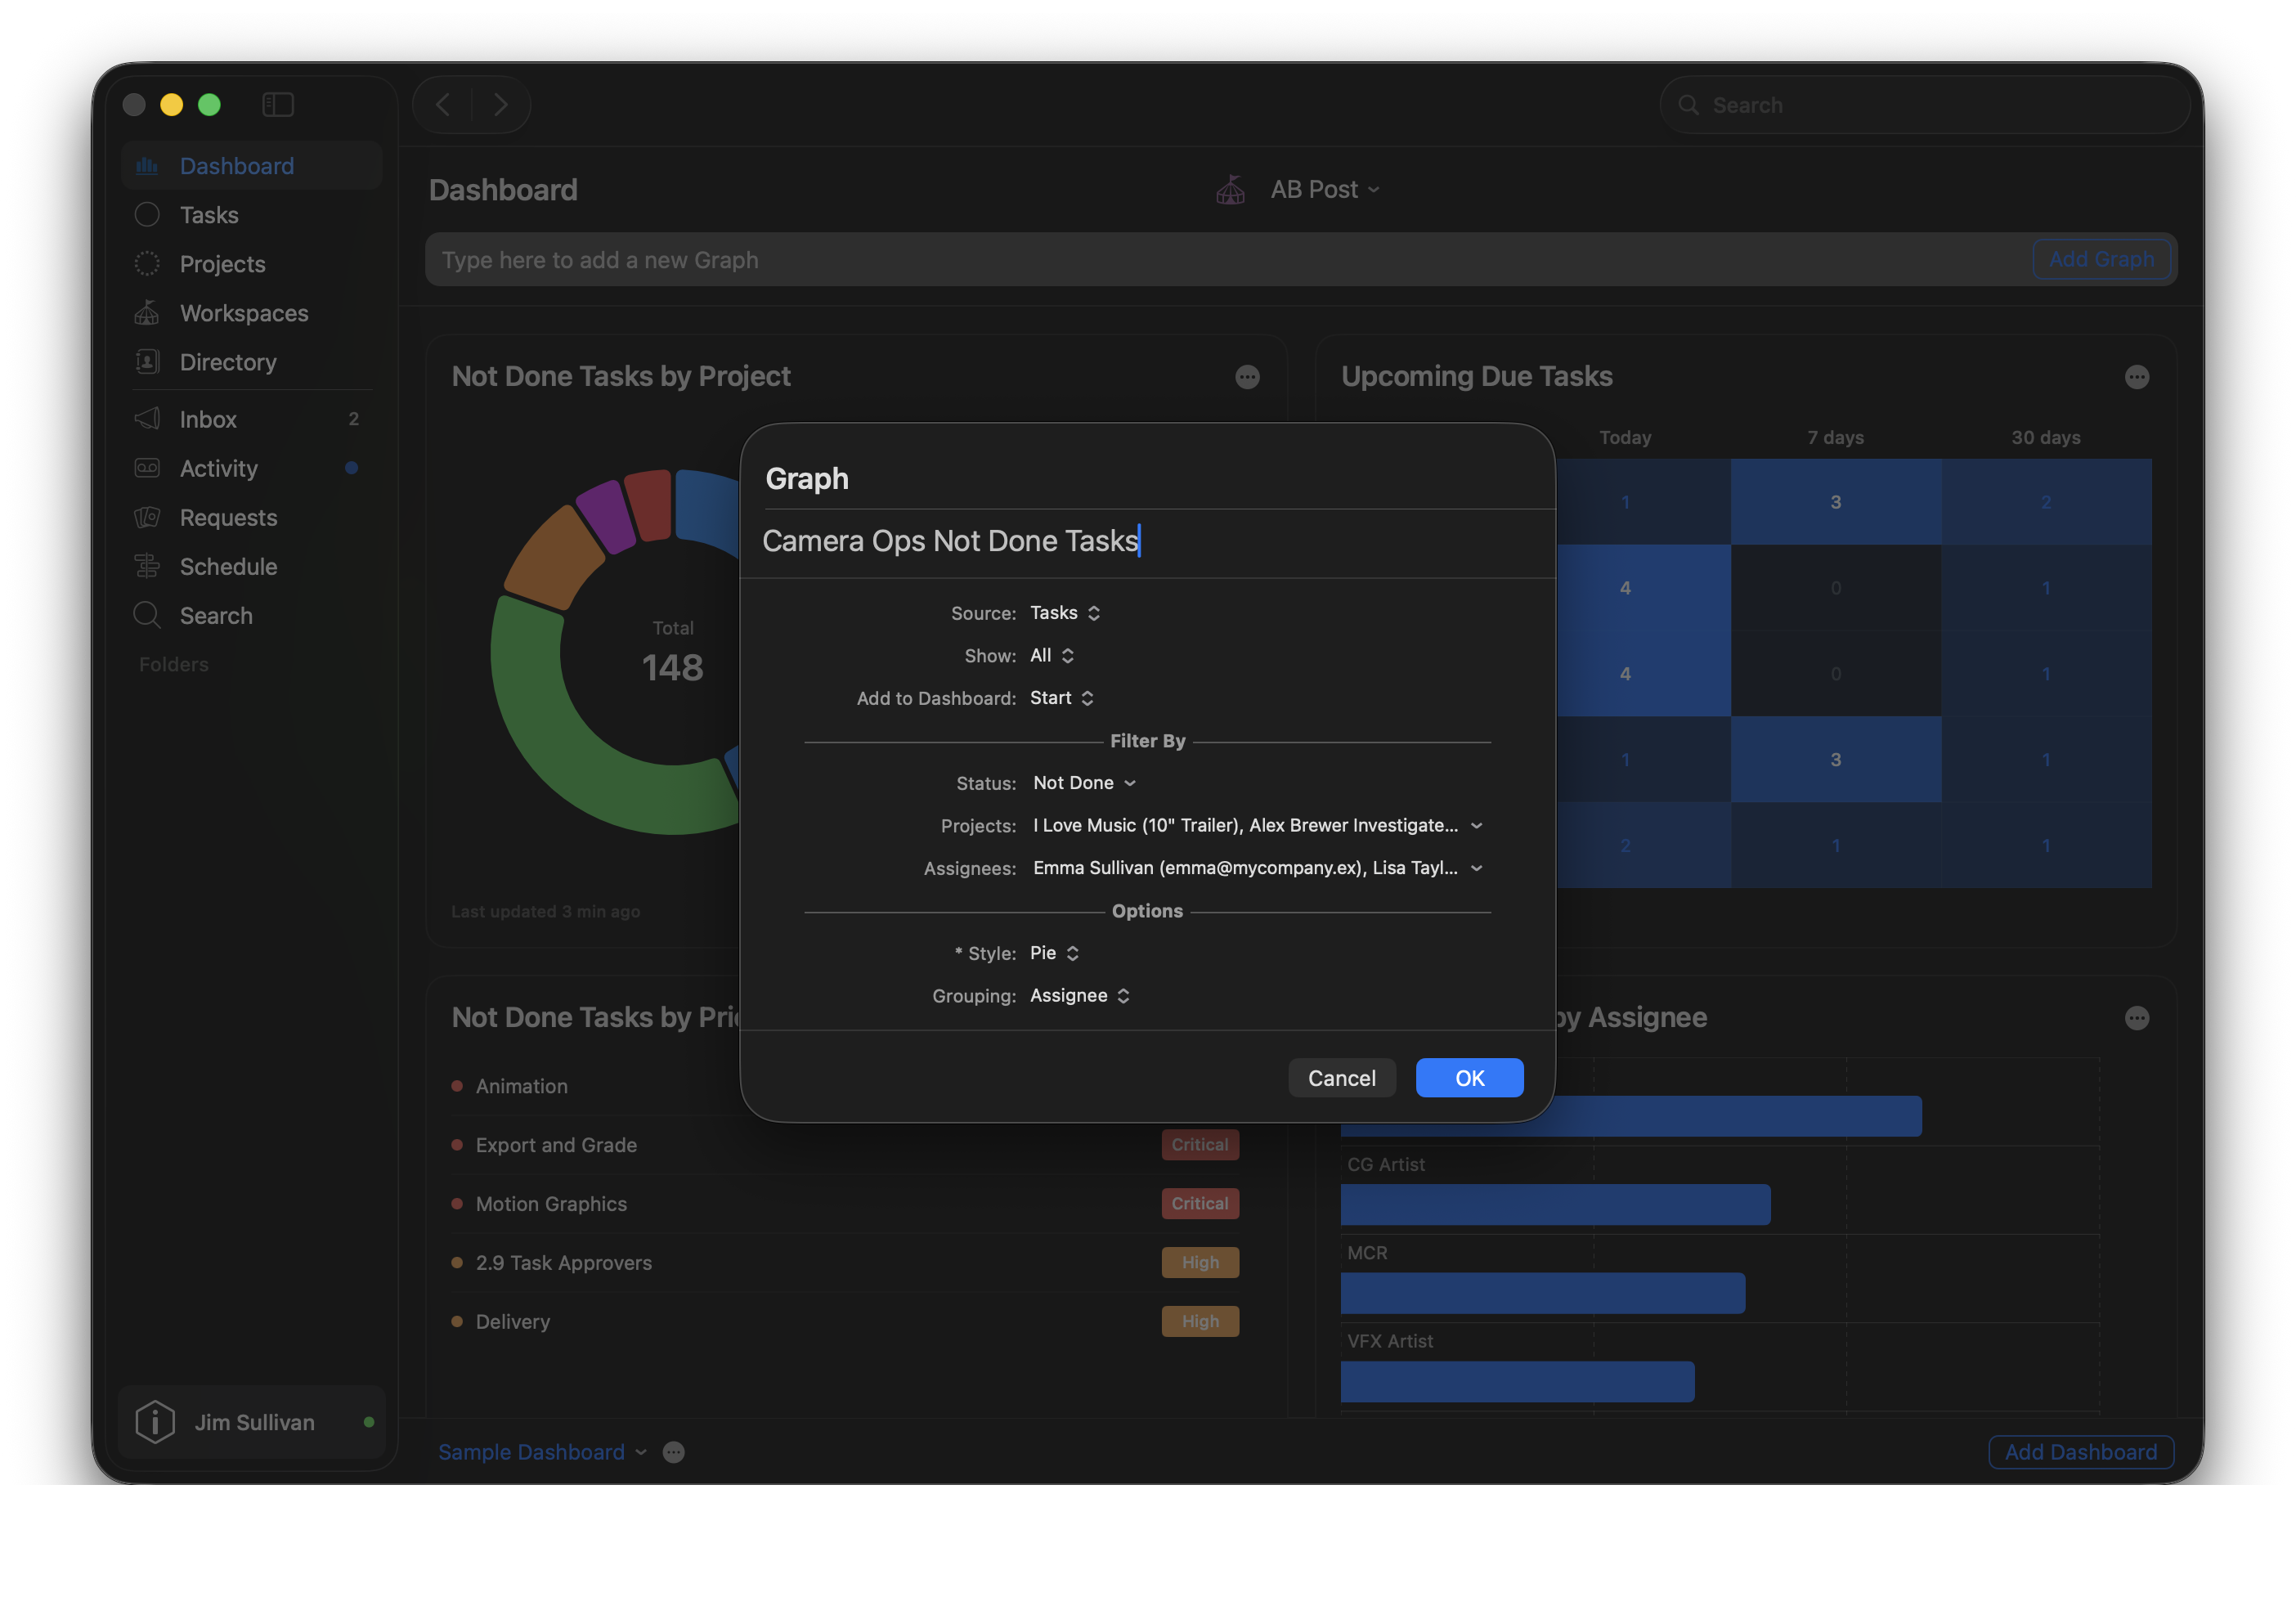
Task Status and Project filters
When creating a Task Graph, Status is one of the main filters and affects some of the other options available.
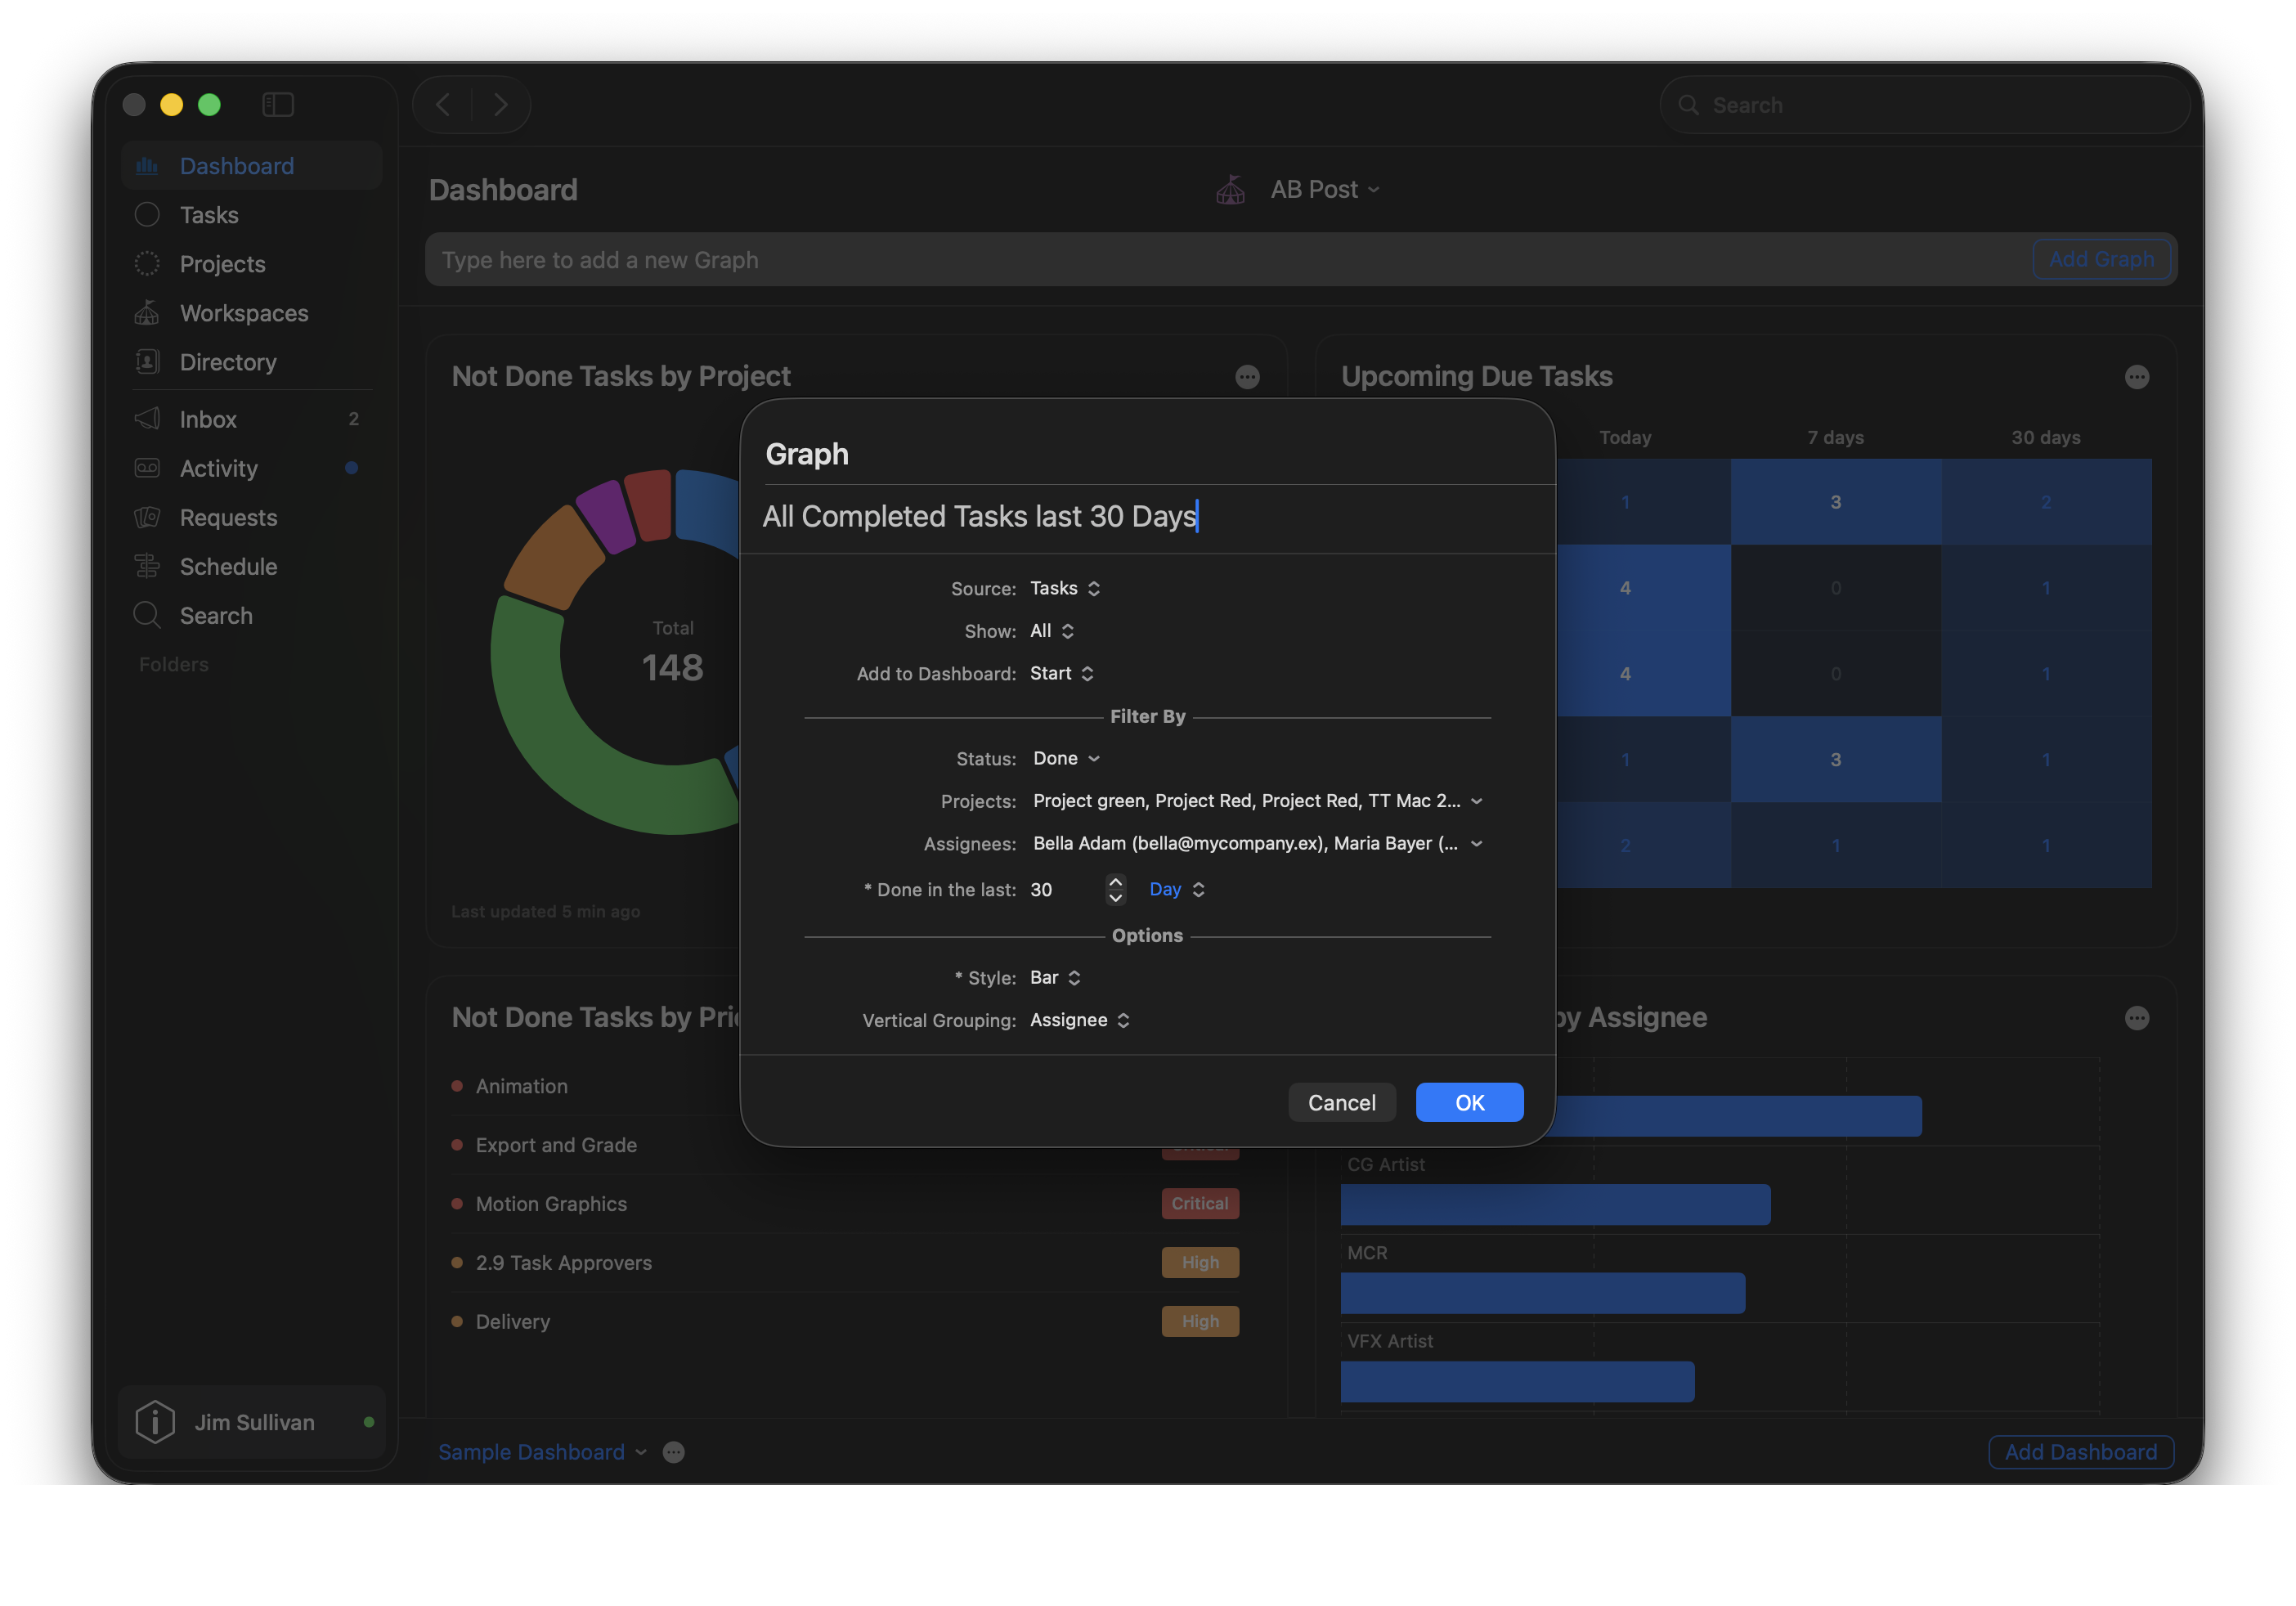
Done Tasks
When Done Tasks are selected, you can use a Last X option to report on Tasks completed within a recent period.
Done Task reports can include Tasks from both Open and Closed Projects.
For example, you might create a Graph showing Tasks completed during the last 30 days.
Not Done Tasks
When Not Done is selected, the Project options are limited to Open Projects.
You can select specific Open Projects or include all Open Projects.
If you change the Status while configuring a Graph, the selected Project filter is cleared so you can choose Projects which are valid for the new Status.
Graph display options
Different Graph styles can be used to make the information easier to understand.
The available styles depend on the information being reported, so not every report can use every Graph style.
For example, Dashboard data may be displayed as visual charts, lists or date-based views depending on the report.
You can also control how many results are shown using the Show option:
- Top 5
- Top 10
- All
Using Top 5 or Top 10 can be useful when you want a Dashboard to highlight the most important information without displaying a very long list of results.
For Quotes graphs you have options to Count the number of Quotes or the Total Quote Value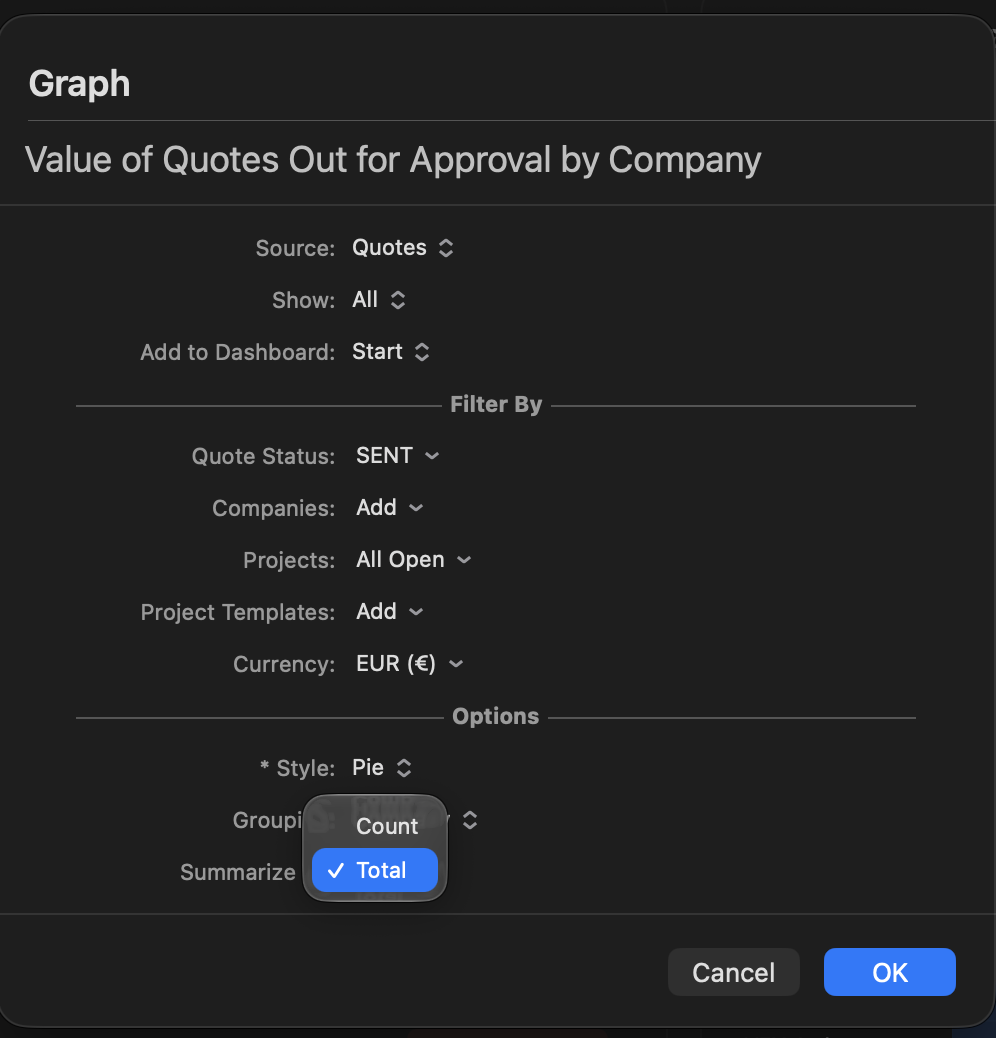
Due Date Graphs
Due Date reporting can help you quickly see work which needs attention soon.
For date-based Dashboard views, Tasks are grouped into three periods:
- Today
- 7 days
- 30 days
This provides a consistent overview of immediate and upcoming work without creating a separate column for every individual Due Date.
Image
Graph Options
In the top right of each Graph you can control the options for Graph.
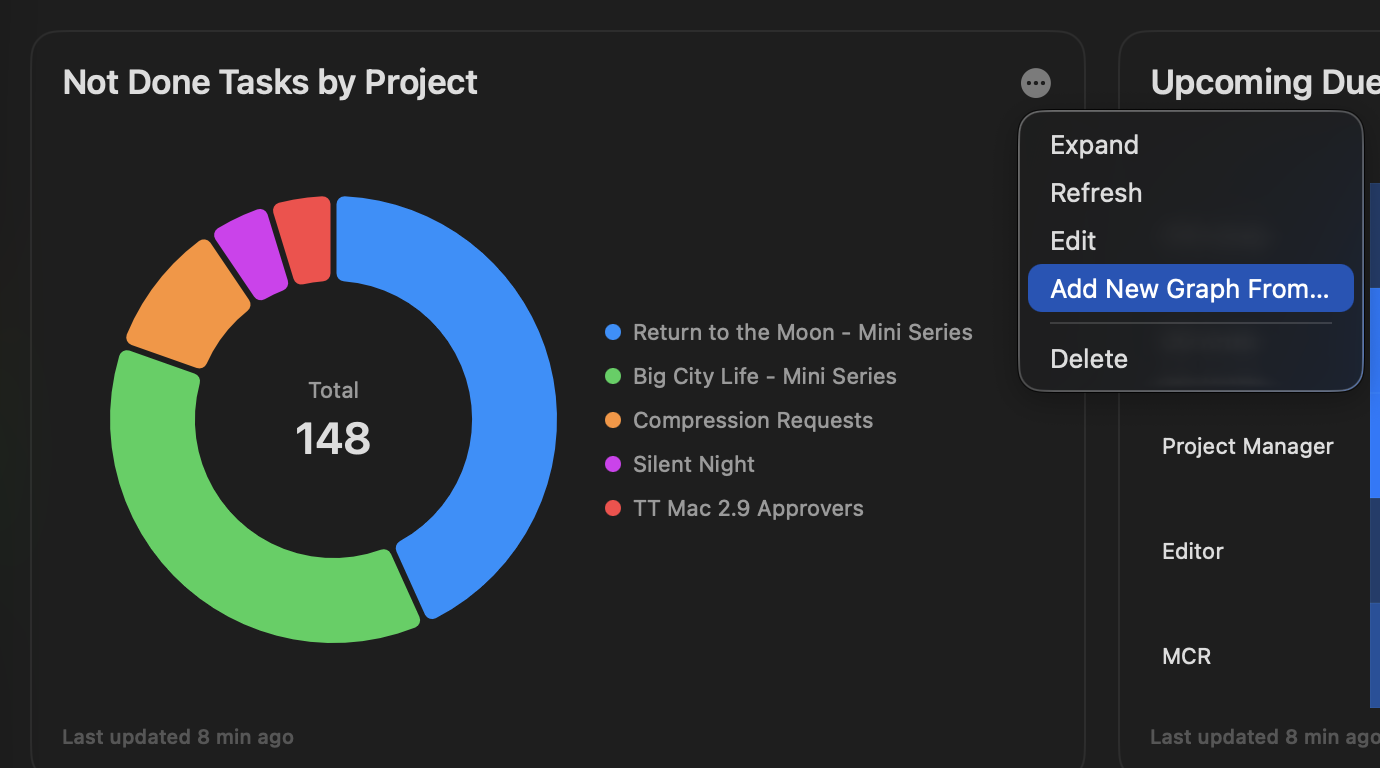
Expand
You can click on the Expand option to temporarily see a graph in full screen
Refresh Graph
Dashboard Graphs are built from summary information from your Workspace at intervals. The last updated date is shown in the bottom of the Graph
Use the Refresh option in the Graph when you want to refresh the Graph data and retrieve the latest summary information.
Edit Graph
Click on the Edit option to modify some of the attributes of the graph.
Add New Graph From..
The option will create a Copy of this graph, open in a New Sheet for editing.
Reorder Graphs
Graphs can be manually reordered so you can place the most important information at the top of the Dashboard using drag and drop
Unsupported Graph options
Dashboard features may be extended with new Graph types and configuration options over time.
If a Dashboard contains a Graph which is not supported by the version of the Cirkus application you are using, you may see a message such as:
Unsupported chart options. Please upgrade the application.
Update Cirkus to the latest available version and open the Dashboard again.
Ideas for your first Dashboard
Not sure where to start?
Here are some useful Task reports you could add to a team Dashboard:
- Tasks Not Done by Assignee
- Tasks Not Done by Task Template
- Tasks In Progress by Assignee
- Tasks Due Today, in the next 7 days or in the next 30 days
- Project Milestones filtered by Project Template (e.g Reversioning)
- Quotes in “Sent for Approval” status by Company
Try to keep each Graph focused on one question your team regularly needs to answer.
For example, instead of trying to show every Task in a Workspace, a Tasks Not Done by Assignee — Top 10 Graph can give you a quick view of where the largest amount of outstanding work currently sits.
Related articles
- Cirkus Tiers and Member Type Permissions
- Create & Manage Workspaces
- Creating and Working with Tasks
- Cirkus Advanced Search and Export
- Customise your Cirkus Navigation Menu
Was this article helpful?
That’s Great!
Thank you for your feedback
Sorry! We couldn't be helpful
Thank you for your feedback
Feedback sent
We appreciate your effort and will try to fix the article